
Understand what your claims are costing — and why.
See every claim in one place, with total costs, cost per driver, at-fault rankings, and historical trends. Capture every collision with detailed documentation, including drivers, vehicles, witnesses, photos, and supporting evidence.
Your trial starts with the Claims / Collision module — enable other modules anytime in Settings.

Open claims
- #C-2044 · Cargo New
- #C-2041 · Rear-end In review
- #C-2038 · Glass Paid
Company vs insurer split tracked
You can't reduce what you can't measure.
When claim information is spread across spreadsheets, emails, and paper files, it's difficult to spot trends or identify recurring problems. Skye brings everything together, giving you a complete picture of your claims before renewal time — not after.
$327K
Cost of one injury crash
FMCSA's per-crash figure for a large truck injury crash — before litigation, downtime, and the premium hike that follows.
$22.3M
Average verdict against fleets
Trucking verdicts grew nearly tenfold in under a decade — and the fleets that lose big are the ones that can't produce the record.
+51%
Cost of a late-reported claim
Claims reported weeks after the incident cost half again as much as ones reported promptly — lag is the most expensive part of the process.
Turn claims data into better decisions.
Skye transforms raw claims data into meaningful insights, showing where costs are coming from, who's involved, which branches need attention, and whether your efforts are delivering results.
Every claim dollar, clearly accounted for.
Track total claims costs, average claim value, and costs by driver or vehicle, with side-by-side comparisons to previous reporting periods.
- See exactly how costs are divided between your company, insurers, owner-operators, and third parties.
- Separate company-paid expenses from insured losses to understand your true financial exposure.
- Filter by branch or date range and export any view as a PDF report.

Avg cost per claim
$11,069
↓ 21% vs prior year
Identify your highest-risk drivers.
See which drivers generate the most claims, the highest costs, and the greatest share of overall losses. Branch performance is measured the same way, making problem areas easy to identify.
- Rank drivers by claim count and total claim cost.
- Compare claim types by frequency and financial impact.
- Monitor aging claims before they become expensive surprises.

Cost by driver
- #1 R. Calderon $34,210
- #2 T. Nguyen $21,880
- #3 S. Patel $16,540
Capture every detail when a collision happens.
Record everything from the initial incident in one structured record, including drivers, vehicles, trailers, road conditions, weather, third-party damage, injuries, witnesses, photos, and supporting documents.
- Instantly see preventable status, towing, hazardous material releases, and claim status.
- Record investigating officer information, badge numbers, and charges.
- Attach photos and police reports, then select any of them for a single ZIP download.
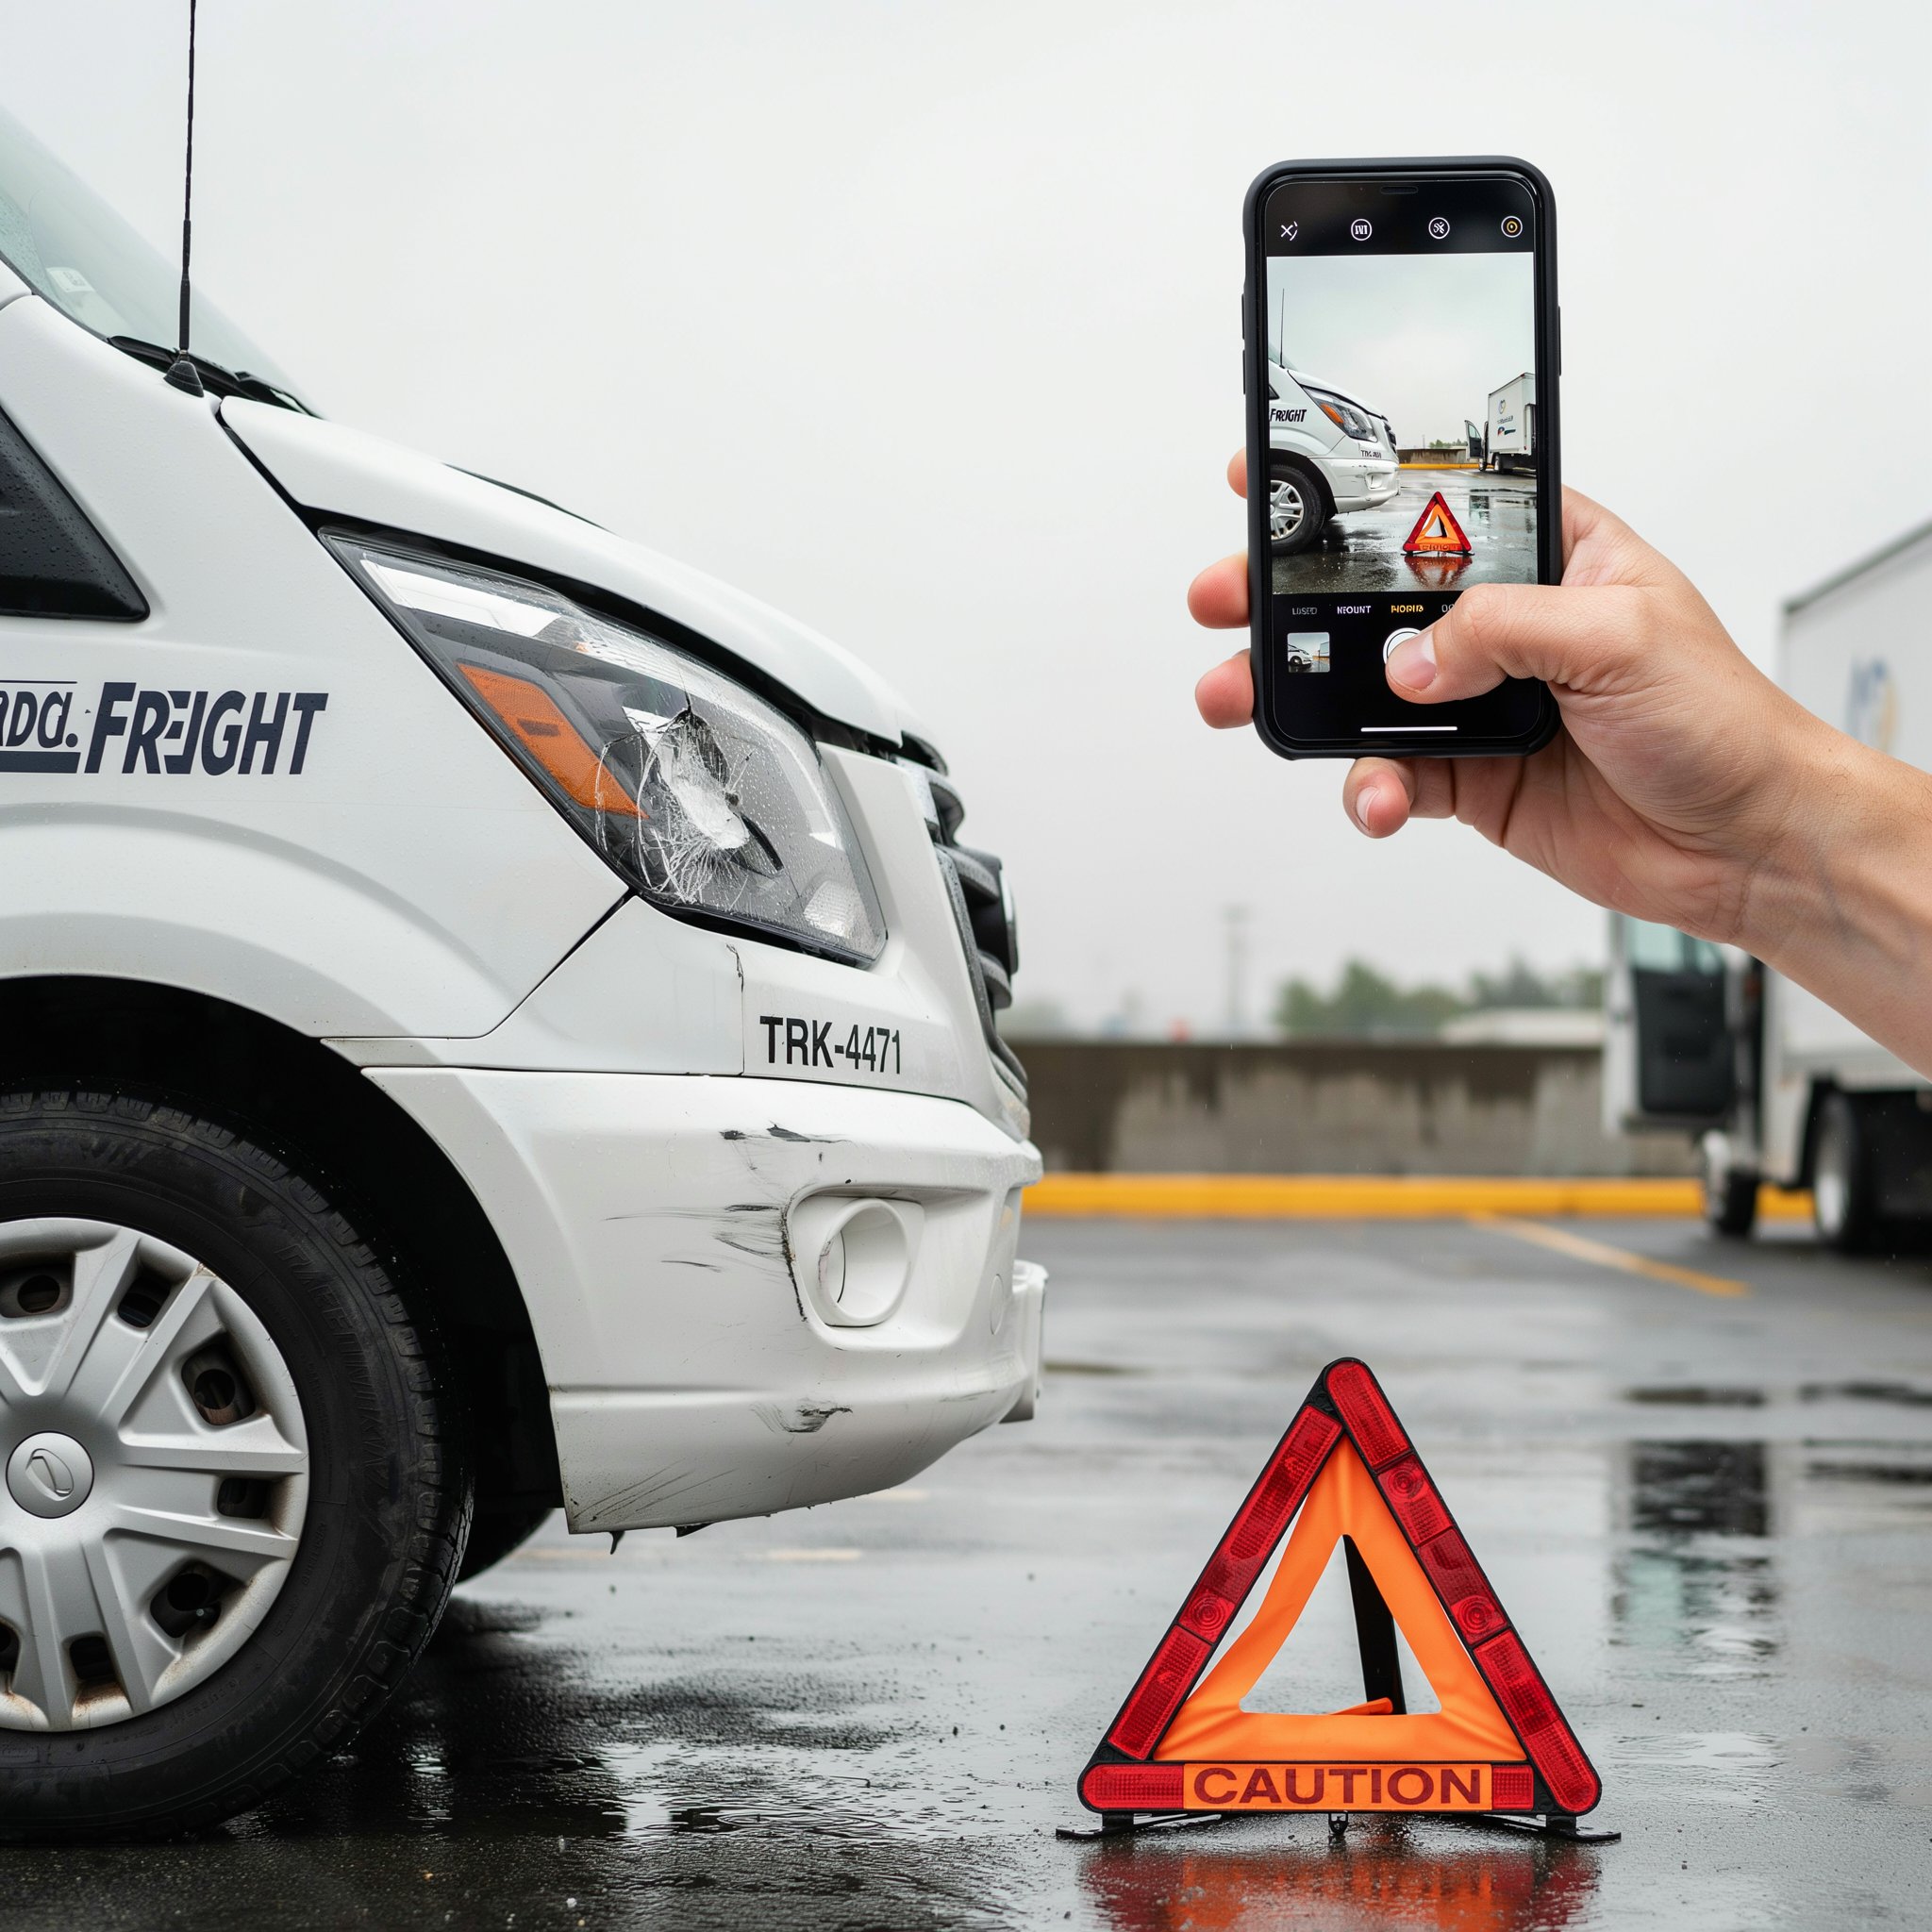
Everything you need to manage claims and collisions.
Skye combines powerful claims management with detailed collision reporting, fully connected to your drivers, vehicles, and trailers.
Claims Dashboard
Monitor total claims, costs, severity, days to close, and performance trends.
Driver Rankings
Identify high-risk drivers by claim frequency and total cost.
Claims Management
Track every claim from initial report through final settlement.
Cost Allocation
Separate expenses between your company, insurers, owner-operators, and third parties.
Collision Reporting
Capture complete incident details, photos, and supporting documents.
Follow-up Tasks
Assign actions, track deadlines, and maintain accountability until every task is complete.
What Claims / Collision watches, and what it holds
Tasks and documents are built into the core of Skye, so nothing important slips past you and every file is there when you need it, wherever you are.
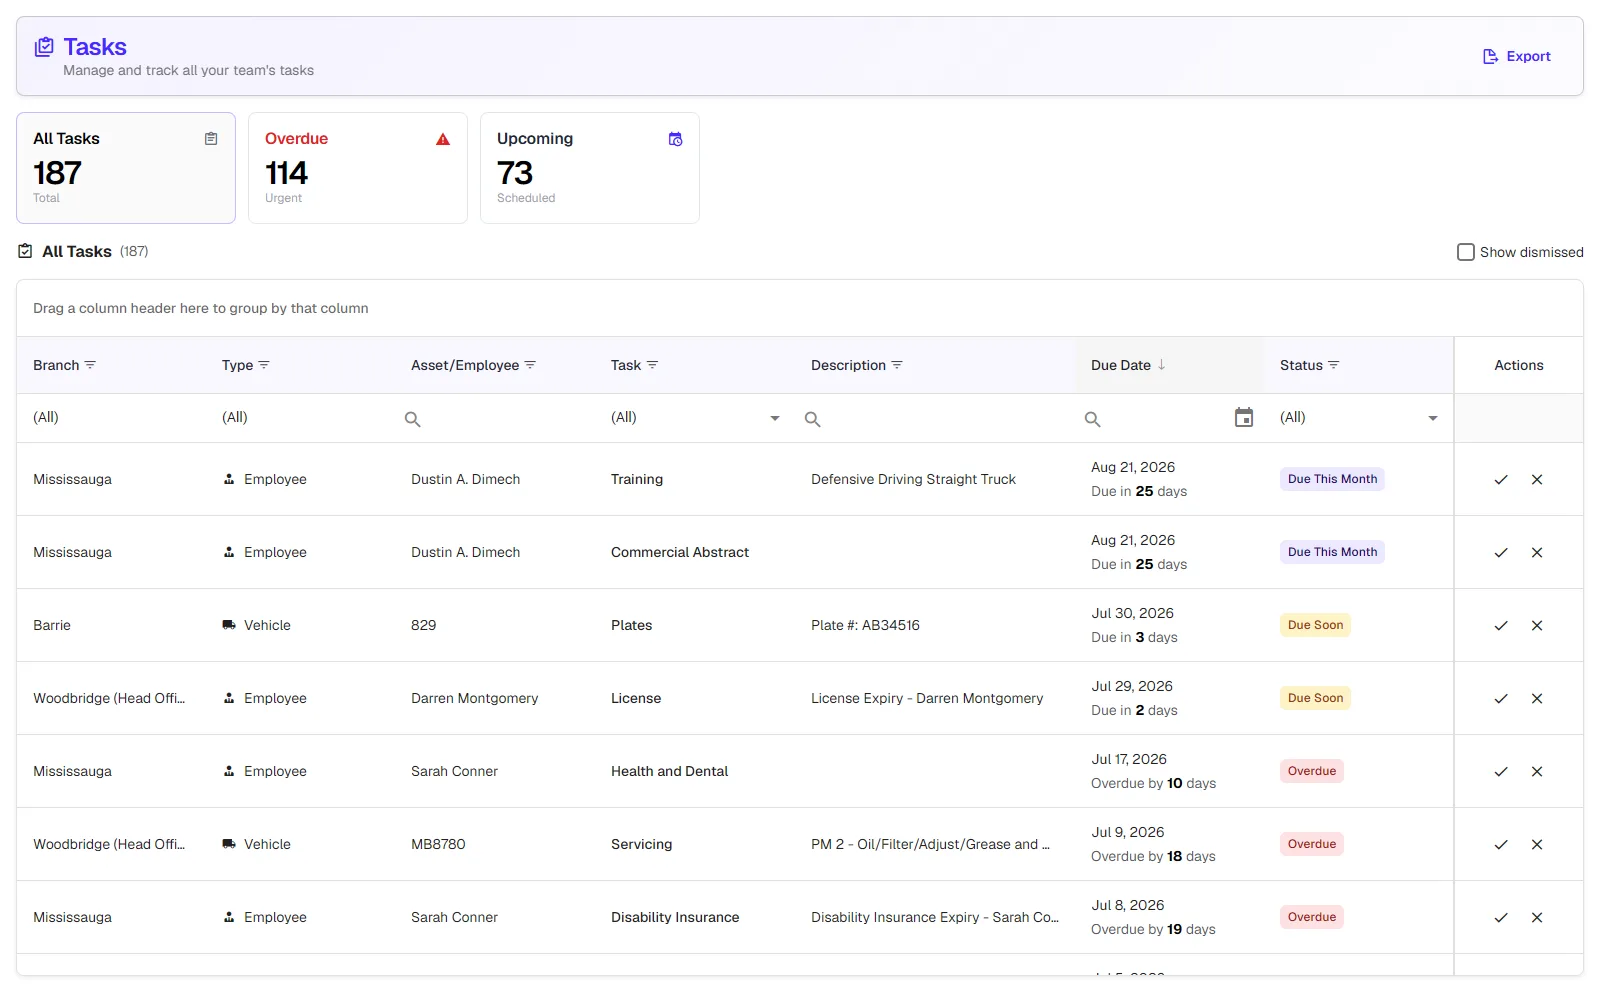
Tasks
Due dates that chase themselves
Configure the interval once and Claims / Collision keeps generating the obligation — overdue in red, due soon in yellow, with one click to the screen that resolves it.
- Collision follow-up tasks with due dates
- Who completed each one, and when
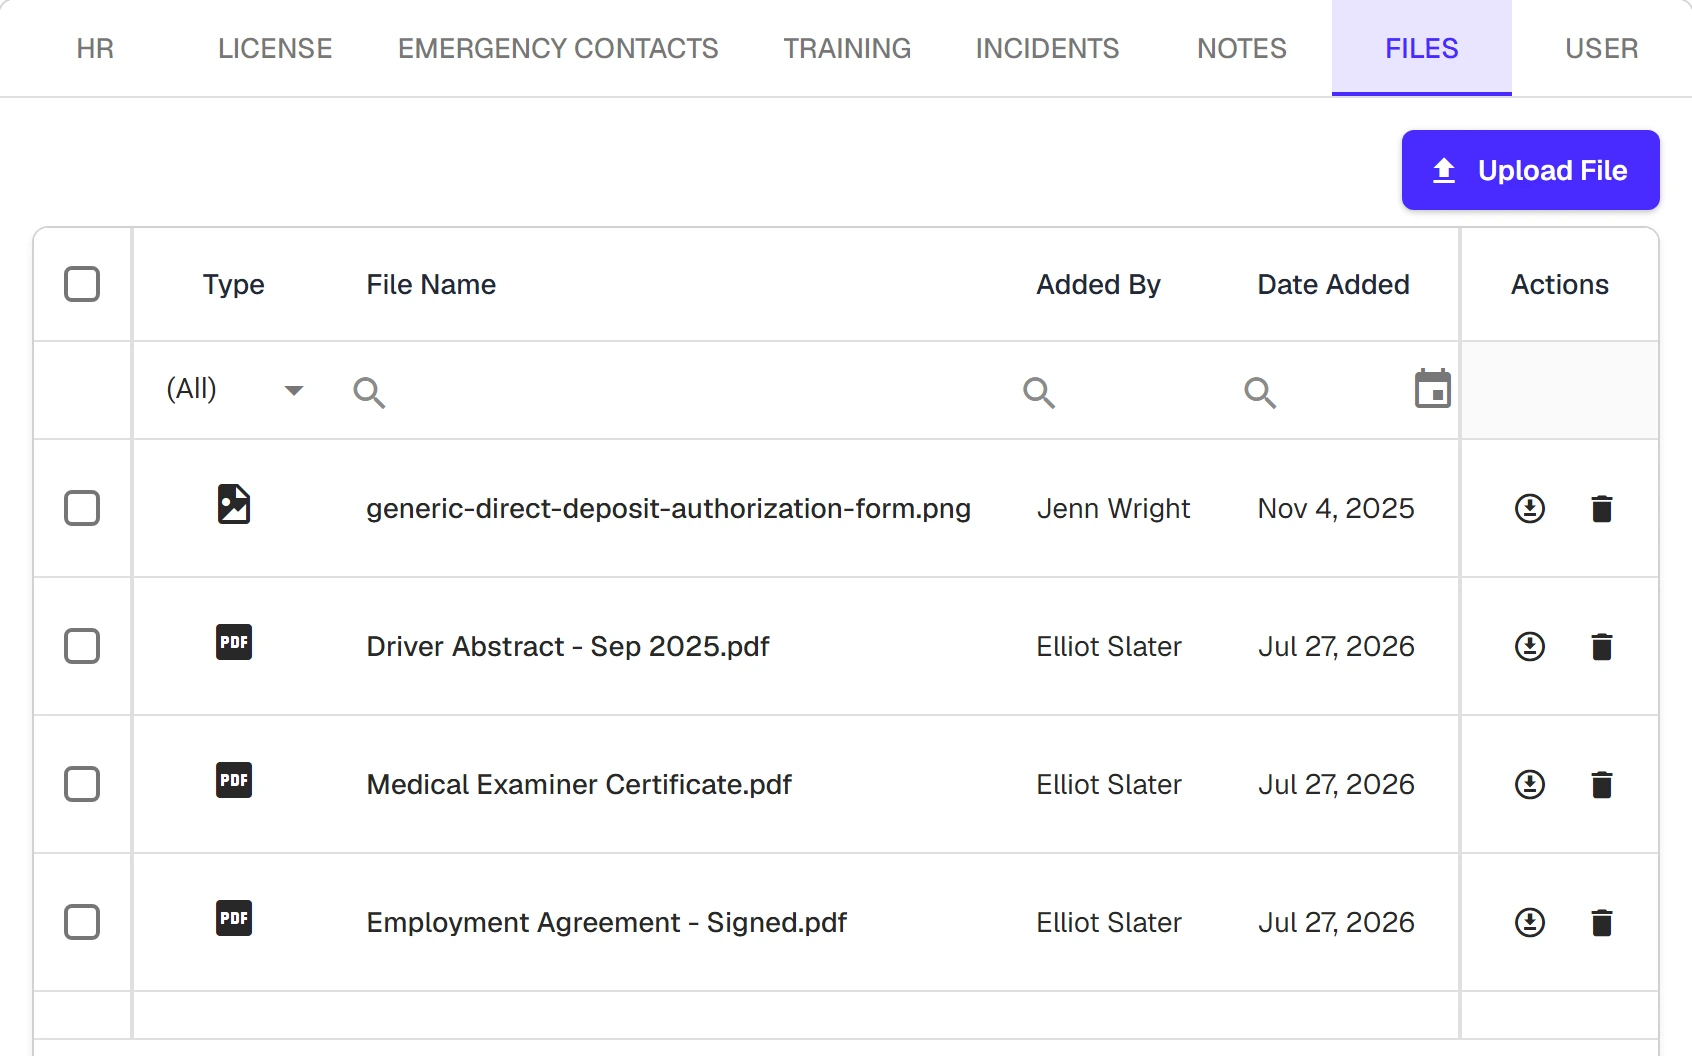
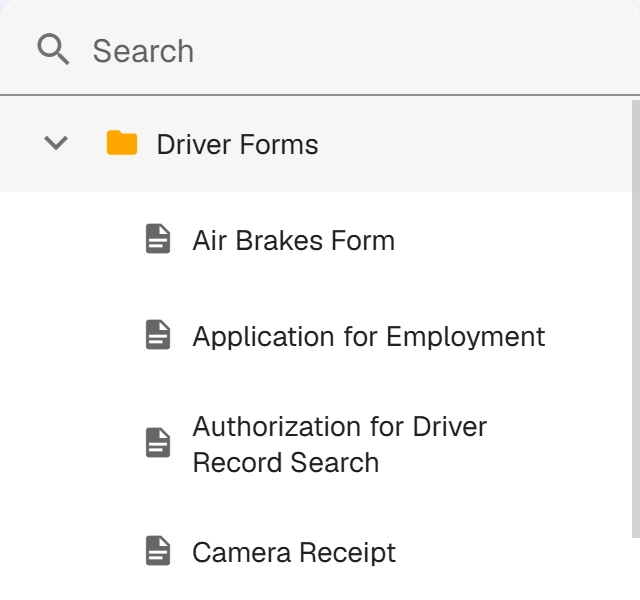

SkyeDrive
Files on the record they belong to
No shared drive to keep tidy. Documents live on the record itself, scoped to the people who should see them.
- Claim and collision files
- Police reports and scene photos
- Bulk ZIP download of the files selected on a collision
From identifying the problem to proving the results
Follow every step of the claims process in Skye — from uncovering the cause and documenting the incident to tracking costs and demonstrating measurable improvement at renewal.
See the big picture
Monitor total claims, claim costs, average severity, and resolution times with historical comparisons that reveal real performance trends.
- Claims per driver or vehicle
- Filter by branch and reporting period
Identify what's driving costs
Pinpoint high-risk drivers, costly claim types, and underperforming branches.
- Driver rankings by frequency and cost
- Claim type analysis by count and value
Manage every claim
Track each claim from first notice through settlement with complete claimant, insurer, and adjuster information.
- Settlement comparisons
- Automatically tracked days open
Document every collision
Capture complete incident details, supporting documents, photos, and witness information in one organized record.
- Incident status tracking
- Police and investigation details
Control claim costs
Track financial responsibility across every payer while monitoring outstanding balances and overdue follow-up tasks.
- Aging reports
- Automated task management
Measure the improvement
Walk into renewal with clear reporting that demonstrates reduced costs, improved trends, and better claims performance.
- Branch and fleet reporting
- Historical comparisons that prove results
Get Claims / Collision on its own, or the whole platform.
Claims / Collision
Over 200 assets? Call us.
- Claims dashboard: total cost, severity, trends
- Drivers ranked by claim count and cost
- Collision capture with full scene documentation
- Every cost split by who paid, outstanding computed
Skye — the full platform
Best valueOver 400 units? Call us.
- Employee & Asset modules — every unit covered
- Incident Tracking & Scorecard included
- Claims / Collisions included
- 1 Warehouse included
Frequently asked questions
What's the difference between a claim and a collision in Skye?
A claim is the money record — claimant, insurer, adjuster, costs, and settlement — and it's what the dashboard measures. A collision is the incident behind the most serious ones, so it gets its own deeper capture: scene conditions, other vehicles, injuries, witnesses, and follow-up tasks. Both live in the same module, so a cargo claim without a crash and a fender-bender without a claim both fit.
How do I find out which drivers are costing the most?
Link drivers to each claim and the dashboard ranks them — claim count, total cost, and share of the fleet's damage, over any timeframe. A claim's cost splits evenly across its linked drivers, so the numbers stay honest when more than one person was involved.
Can it handle owner-operator and third-party costs?
Yes — every cost line splits across four payers: company, insurance, owner-operator, and third party, with the outstanding balance and percent paid computed automatically. No side spreadsheet to reconcile who owes what.
Does it connect to my drivers and vehicles?
If you run the Employee and Asset modules, collision reports pull the driver's license details and the vehicle's make, VIN, and plate straight from their records. Claims can link multiple employees to one claim.
Is Claims / Collision part of the Skye platform, or can I get it on its own?
Both. Run Claims / Collision on its own for $49/mo (up to 200 assets), or get it included in the full Skye platform ($200/mo + $3/unit). See full pricing
Find the problem. Fix it. Prove it.
Put every claim and every collision on one system — costed, ranked by driver, and trended over time — and walk into your next renewal with the numbers. Start your free trial or book a demo today.